21 Million
The design process
Introduction
There are many ways to express data from the Bitcoin blockchain.
Some ways are more dry than others: tabled-data and charts are all OK but are completely devoid of joy.
We decided to use a more visual medium to show Bitcoin data found on chain and this is the result.
Each piece is unique and represents the Bitcoin data for the day, starting on 3 January 2009, the date at which Satoshi Nakamoto mined the Genesis block.
Read below to see what data is included in each piece and how it is expressed.
1. The canvas
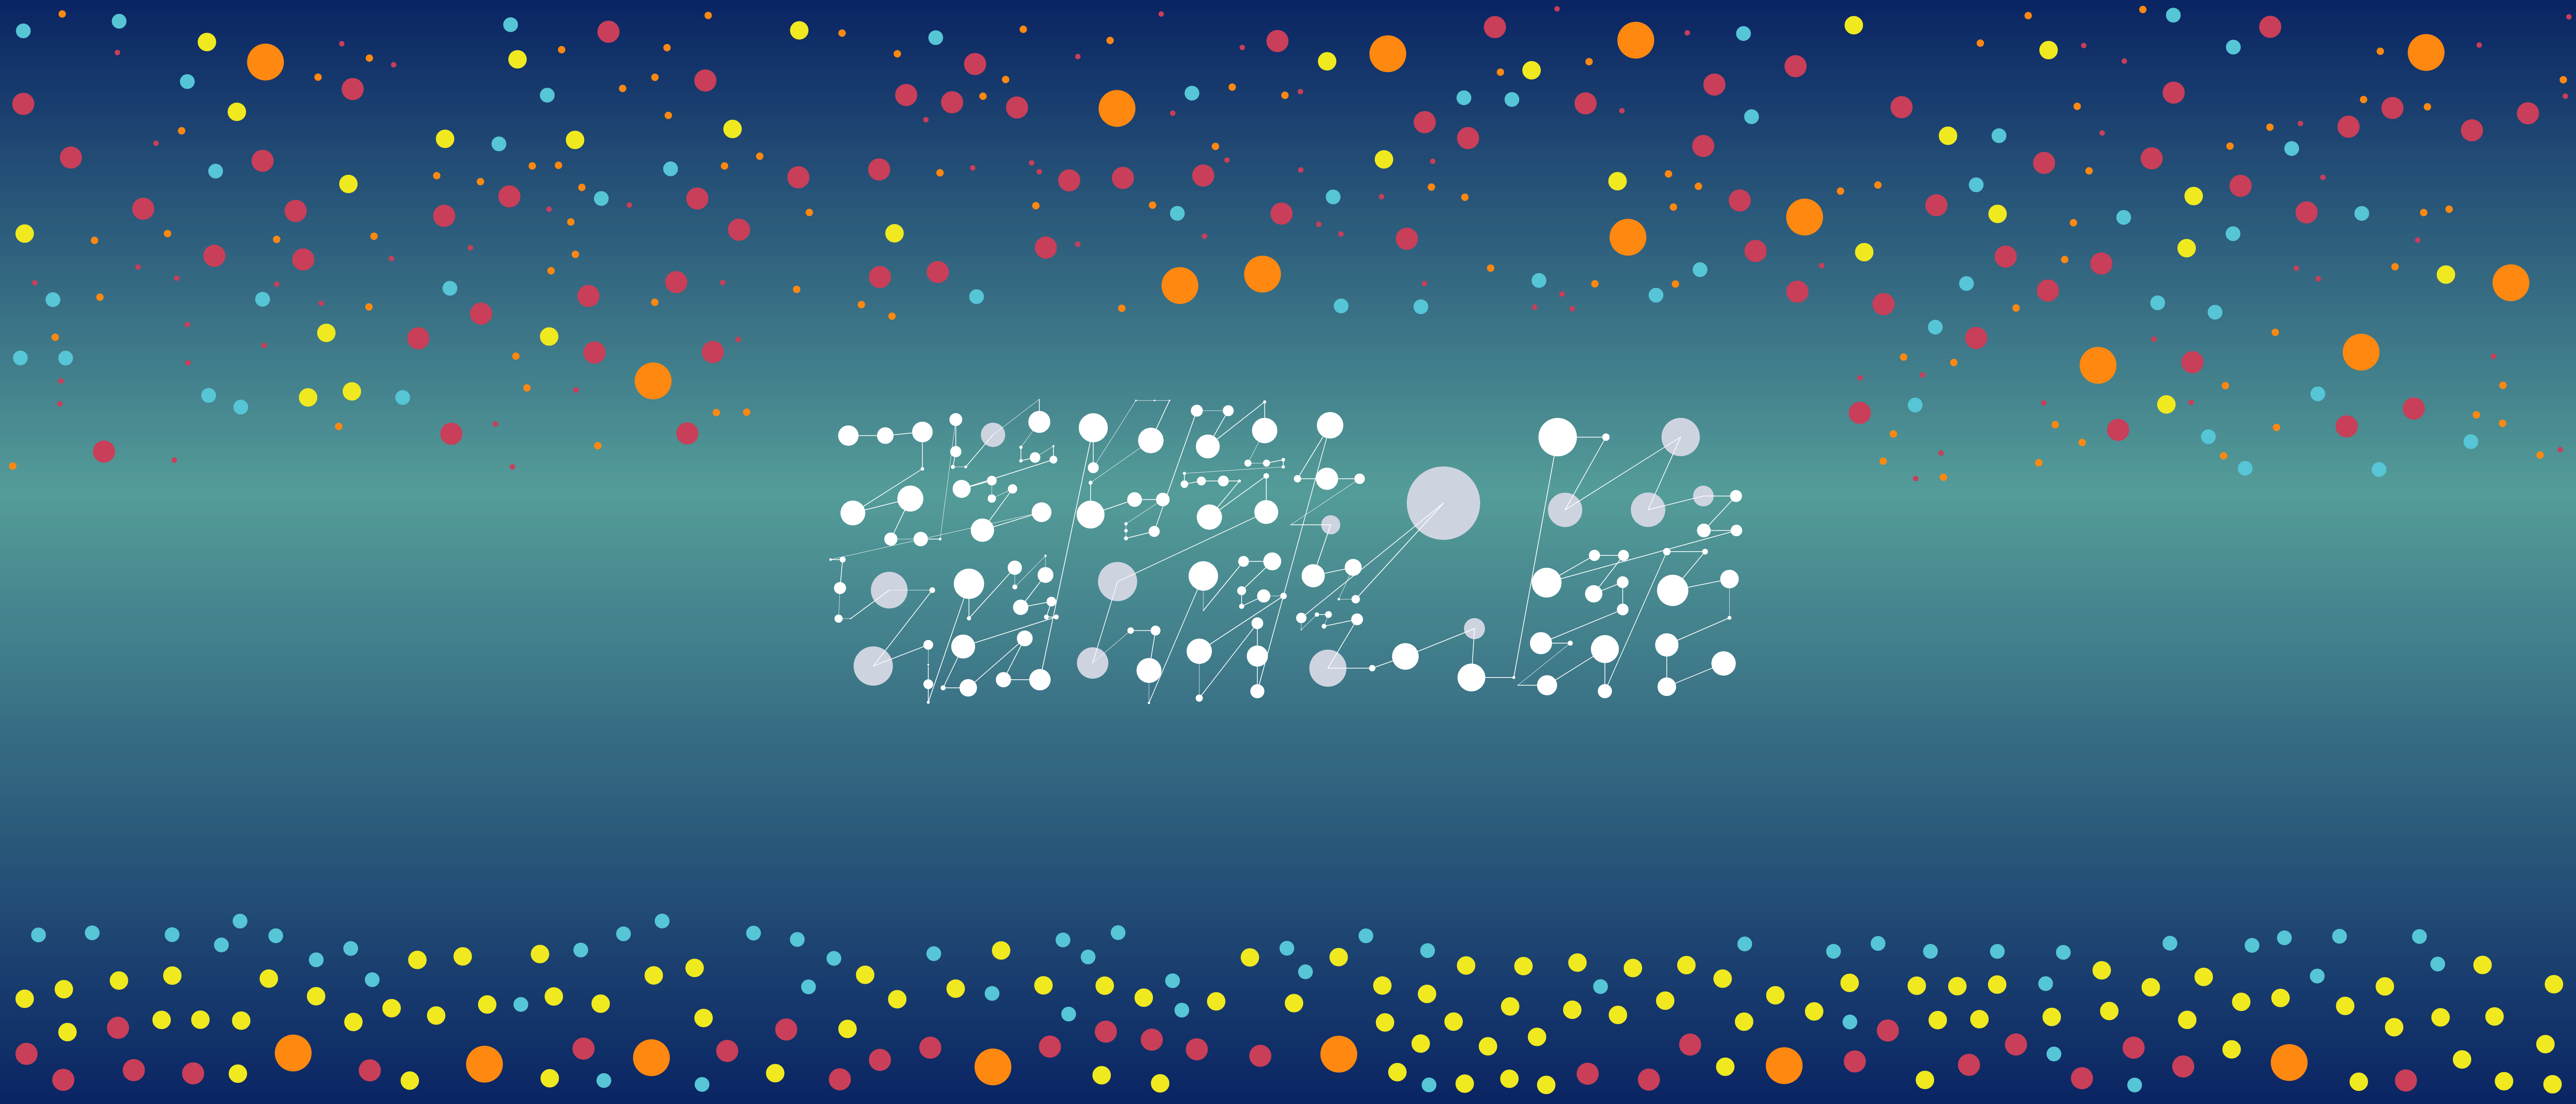
Each canvas represents the bitcoin network of the day, with a focus on mining activity.
The central rectangle shows all the blocks mined that day and a line shows the order in which they are linked in the blockchain.
All canvases are 7000x3000 or 21 million pixels, an obvious nod to the total number of bitcoin that will ever be mined.
Each period has a different background color:
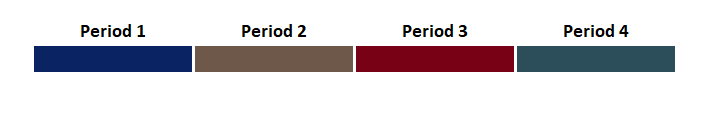
To color the background we draw a gradient from the color above to the color of the horizontal line described below.
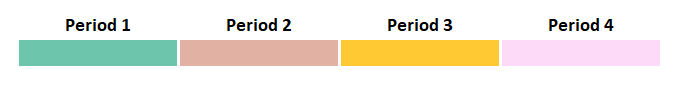
2. The horizon line
The horizon line shows the halving progression. As the period between halvings progresses, the horizon line rises up, starting from the bottom of the central rectangle to the top of the central rectangle.
You can see that on halving days (2012-11-28, 2016-07-09 and 2020-05-11), the horizon line is aligned with the base of the inner rectangle.
Here are the colors:
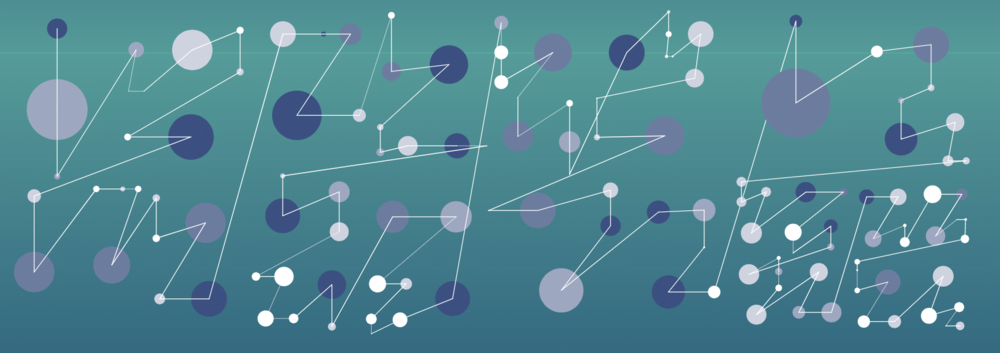
3. Mined bitcoin, past and future
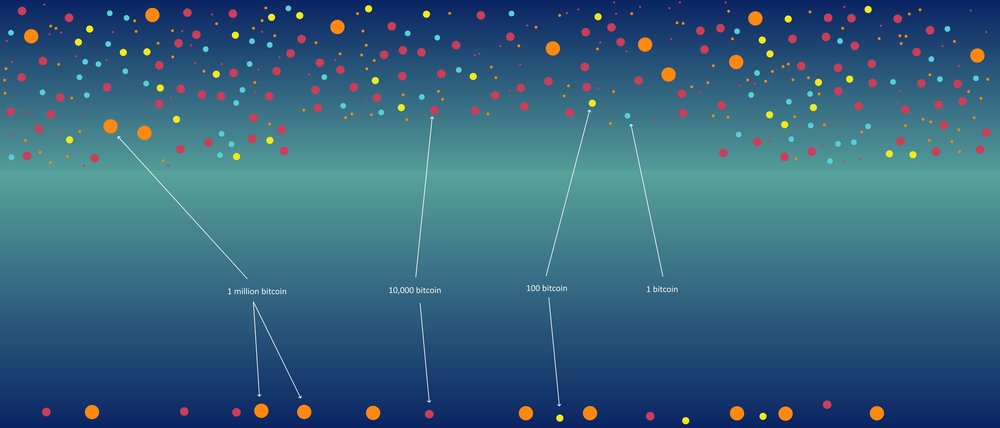
All 21 million bitcoin are present on each canvas, expressed as differently-sized “stars”.
While the central blocks contain the bitcoin mined that day, the top part of the canvas contains all the bitcoin that will be mined in the future and the bottom part of the canvas contain the bitcoin that have already been mined.
The stars are placed randomly on the canvas but don’t collide with each other or with the central rectangle.
Here is a table representing the weight of the stars as well as their colors:
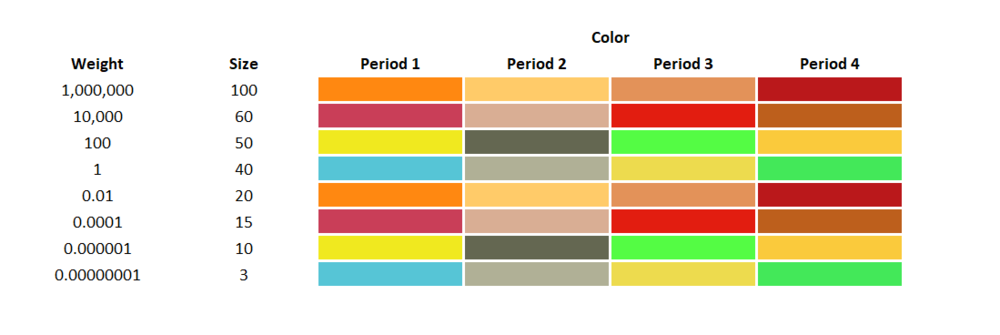
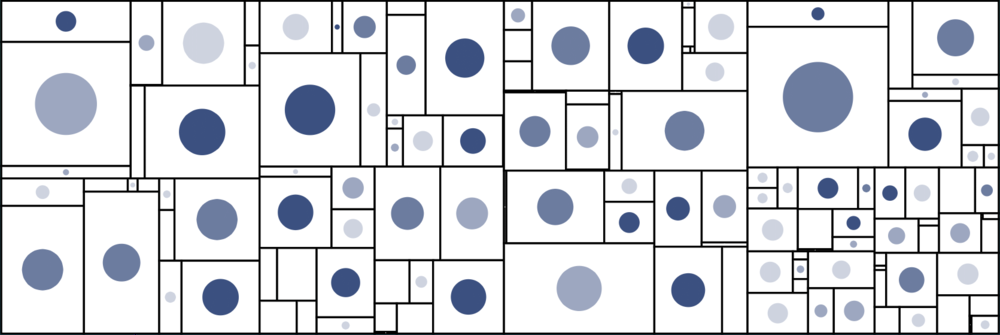
The result will look like this:
4. The central part
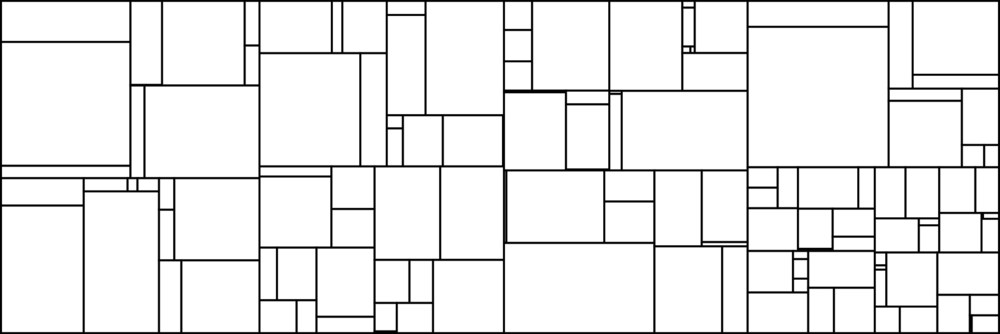
Treemap
A treemap is a way to display hierarchical data structures in a manner that translates the weight of a data structure into an area size.
You would have seen treemaps in representation of space allocation in hard drives, like in WindirStat for example.
For all the blocks of the day, a treemap is calculated showing all the blocks, sized according to the number of bitcoin transferred in each block.
As a result, blocks with more bitcoin transferred will appear bigger than blocks with fewer, but proportions are kept thanks to the virtue of treemaps.
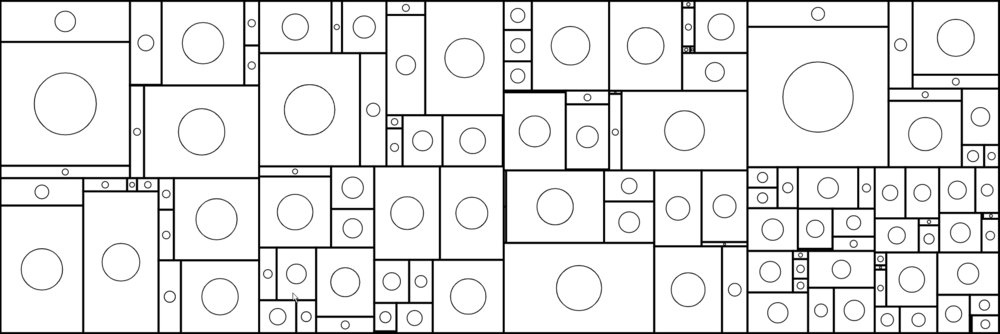
Stars
A circle with a radius equal to half the smaller width of the rectangle is then drawn.
Each circle represents a block.
Blocks colors
Blocks are colored according to the number of transactions they hold.
Taking as a starting point the background color, we chose 5 tints going from 20% to 100% (white) and 5 shades going from 20% to 100% (black) to show blocks packed with transactions.
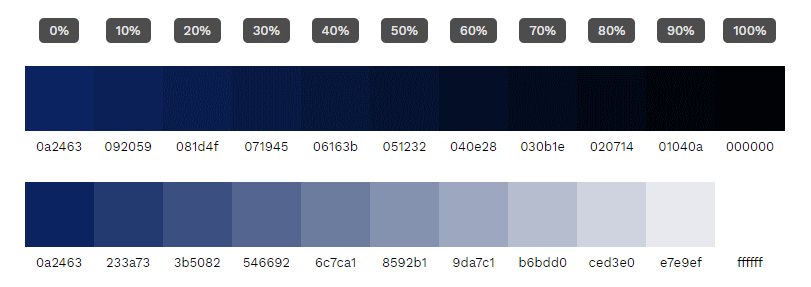
A white block will have few transactions while a block with a color getting close to black has a lot of transactions.
This is also the reason why blocks in the first period appear mostly white: they contain few transactions, sometimes only the coinbase.
Recent blocks, however are dark as they usually contain 2000-4000 transactions.
Lines between blocks
Between each blocks, a line has been drawn so the blockchain’s progression can be easily followed.
The thickness of the lines drawn varies according to the size of the origin block. If block n is big, the line linking it to block n+1 will be big.
Again, early blocks have very thin lines.
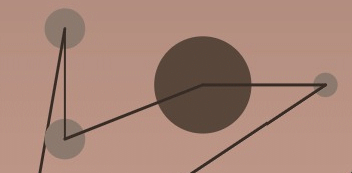
The last step of the process is to remove the treemap rectangles and let the stars float.
5. Technology used
- NBitcoin to extract the Bitcoin network data we use a Bitcoin Core node
- p5.js to generate the artwork
- tinycolor in places where we need to do some colors manipulations
- NFT Storage to store all the produced artwork
- OpenZeppelin for the smart contract interfaces
- Hardhat for the development environment
- ethers.js to help with development on Ethereum
A heartfelt thank you ❤️ to these projects’ creators, maintainers and contributors.